-
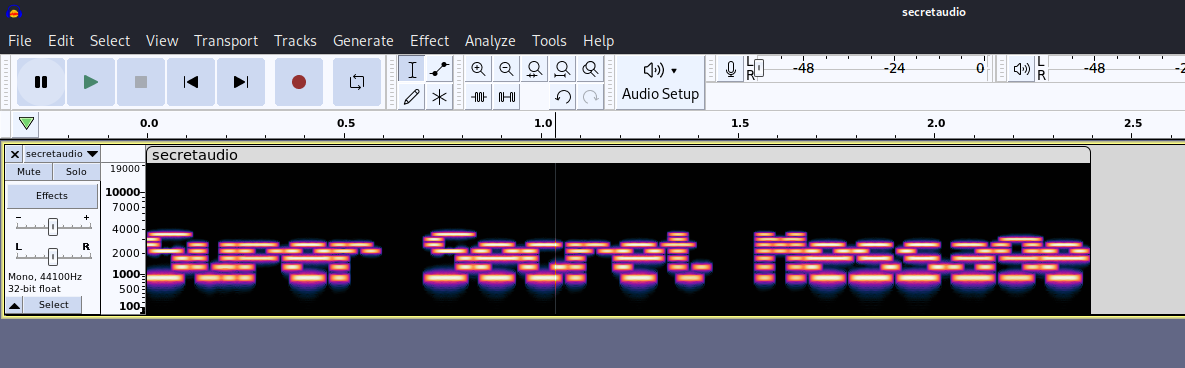
Spectrogram: A spectrogram is a visual representation of the spectrum of frequencies of a signal as it varies with time. When applied to an audio signal, spectrograms are sometimes called sonographs, voiceprints, or voicegrams. When the data is represented in a 3D plot they may be called waterfalls.
-
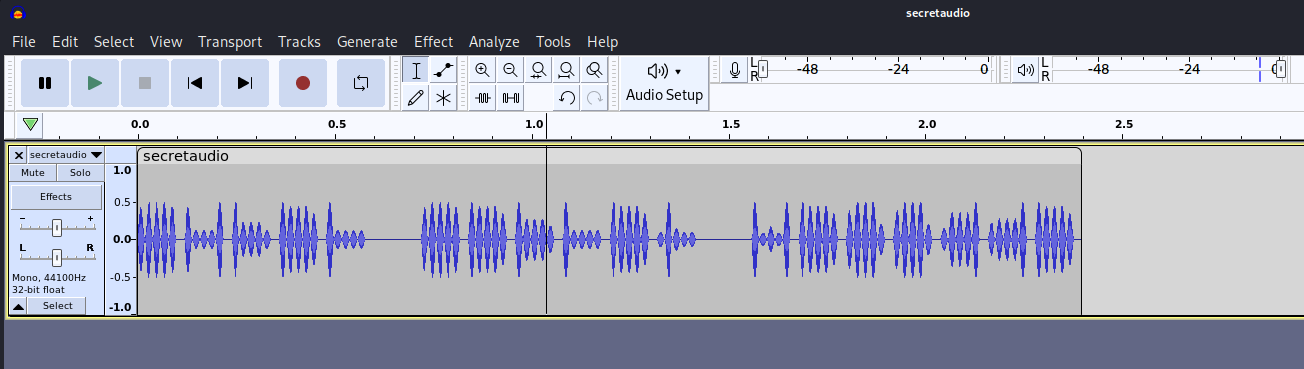
Use tool audacity to watch them
- Opening a
.wavfile usually
- Opening a
- Click on the name of the file >> Spectrogram